 We’re in the midst of what the World Economic Forum call the 4th Industrial Revolution, and this is characterized by the blurring of boundaries between the physical and digital. The Internet of Things means that everything from railway tracks to refrigerators are capable of generating data to help us make more effective use of them.
Indeed, Gartner predict that around 25 billion things will be connected to the Internet by 2020, with those items collectively generating around 600 zettabytes (ZB) per year. To put that into perspective, that is roughly 275 times more than the traffic flowing from data centers to end users, and 39 times higher than all traffic to and from data centers. In other words, it’s a lot.
In God we trust
W. Edwards Deming famously remarked that “in God we trust; all others bring data,” and it seemed like a perfectly adroit comment to make a generation ago because data was in short supply. Now however, data is in abundance, and we might amend Deming’s quote to reference the importance of insight. When you can see vividly each individual stalk of hay, the value comes in being able to see the needle among them.
A number of companies are attempting to make such insights vivid and visual. For instance, I wrote last year about Beautiful Information, the Nesta backed startup who have developed an Operational Control Centre app that aims to present data in a more accessible way.
The app aims to transform previously unmanageable data into usable information by displaying it in a visual and real-time way to both managers and clinicians. The app comes with a customizable dashboard so teams and organizations can gain access to the exact data they desire, whether that’s patient waiting time or the throughput of a particular department.
Visual data
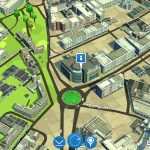
Also taking a visual approach to data analysis is Dundee based startup Wrld. The company has roots in the gaming industry, and attempts to use the kind of engagement mechanics that are commonplace in video games to make enterprise data more accessible.
The company work with a wide range of systems integrators, which enables them to operate in a number of different niches, as their virtual worlds are used in various ways, from visualizing smart cities to understanding office utilization.
For instance, the technology is being used to replicate the new Bloomberg office building in London. Whilst initially the aim is to help staff find both their way around the new building, but also their colleagues, the potential use cases go significantly beyond that. For instance, it’s easy to imagine a time where the smartphone app that accompanies the system is used not only to monitor employee movement patterns, but also to access meeting rooms, cafeterias and other communal facilities.
With an average of 25-30% of rented office space typically going un-utilized, this kind of insight could be a welcome boon to a sector that has long struggled to apply a scientific approach to designing the ideal workplace.
The company, which recently moved headquarters to Los Angeles, has three core software development kits to help developers create realistic visualizations, whether of the interior of buildings or cities. These include WRLD Map Designer and WRLD SDK for Unity, which helps developers to build streaming 3D maps for location based projects.
They’re an interesting company, and as the challenge has moved on from collecting enough data to successfully analyzing it, their approach is one that’s well worth keeping an eye on. Check out the video below to see their creations in action.