 The last few years have seen a tremendous rise in the amount of public data that is available via open platforms. This has allowed a wide range of fascinating projects to emerge that visualize our local neighborhoods.
For instance, the Whereabouts in London project aims to take public data and provide a visual display of what particular parts of London are like. It uses around 235 different types of data to present users with a rich overview of an area.
Animated data
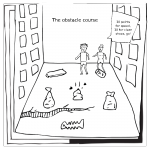
Another fascinating project along these lines is the New York based HereHere. They take public data for a host of New York City neighborhoods and produce a cartoon based on the data.
The project is the work of Microsoft Research’s FUSE Labs and aims to make data more compelling and connect us with our local areas via the production of cartoons.
The platform doesn’t use sentiment analysis but rather a research platform that uncovers the most important information about an area from a human perspective.
Several times each day fresh data is collected, with each bit of data categorized according to a long list of concerns issued by the people of New York. These can include things such as heating complaints.
The data is then divided into the 42 neighborhoods throughout the 5 boroughs of New York, and tally up the total number of entries for each item of concern, per neighborhood.
This data is then processed through a Sentient Data Server, which equips each neighborhood with a personality, which is then used to calculate the response of that neighborhood to the latest data.
So, for instance, a neighborhood might be perceived as happy if after a prolonged period of heating complaints, those complaints dropped to zero, or it might come across as ashamed if homelessness shows an increase.
Each neighborhood is assigned the top 311 issues each week by the service, with the data then fed into the production of a weekly cartoon to reflect what’s happening.
It’s a nice way to visualize what are the hot topics on a local level.
I can't say I'd want to 'tune in' to the cartoons, but it's a clever technology that creates them. Very clever.
I still don't quite understand how it works. There is a cartoonist (Iris Gottlieb) but I don't know how her work process fits into this. Does the system generate a barebones story that she illustrates? (i.e. "thinking" and story has been outsourced to the system and the cartoonist draws?)
Hi Virpi, yes, I imagine the system generates a narrative based on the data that Iris then illustrates.