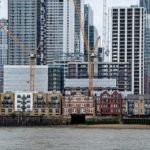
 Suddenly, a yoga studio pops up where a barbershop used to be, a coffee spot replaces a small grocery, and a tall apartment building stands where old houses once were.
For folks who’ve lived in the city for a while, these changes can be surprising. They know that once these physical upgrades happen, it might be too late for local leaders to protect them from skyrocketing rents and shifts in who can afford to live in the area.
Even though these changes are easy to see, figuring out gentrification and its effects has been tough for researchers, says a recent study from Stanford University’s School of Humanities and Sciences.
Richer data
Researchers usually rely on demographic info from the U.S. Census, which only happens once every ten years, or the American Community Survey (ACS), which takes place every five years and isn’t very detailed. Plus, the data from these sources is grouped by census tract, not specific buildings.
Now, the researchers talk about teaching a computer program to spot signs of gentrification—like new construction or renovations—in Google Street View pictures for entire cities.
In their recent work, the team found that the computer model predicted gentrification about 74% of the time in the same areas where earlier studies using census and ACS data had found it. The model also noticed early signs of gentrification in nearby census blocks that were previously thought to not be gentrifying.
“Detecting change at the image level really complements the demographic changes we’ve seen in other data that’s not as granular,” the researchers explain.
Changing face
Gentrification, the improvement of once-low-income urban areas, is not fully understood. Surprisingly, research shows that population displacement, a major gentrification concern, is not directly linked to gentrification. The puzzle is this: if gentrification leads to displacement, areas that don’t undergo gentrification should experience less displacement. However, most forced moves occur in non-gentrifying low-income neighborhoods that lack investment.
The challenge lies in deciphering whether the high mobility rates in low-income, mostly Black neighborhoods without gentrification result from nearby gentrification causing rent pressure. Prices rise across the city, impacting these neighborhoods, even if higher-income individuals don’t move in. To better understand these dynamics, more detailed data is required.
To tackle this, researchers turned to Google Street View, a dataset of street-level images covering major and minor cities globally. Created in 2007 and regularly updated, this dataset is not aggregated and includes images of every road stretch, building, and vacant lot. Using construction permits and national business data, they identified planned construction and business upscaling (e.g., from laundry to coffee shop). Confirming gentrification examples by manually checking before/after images, they trained a model to recognize building upgrades.
Put to the test
The model employed a “self-attention mechanism” to ensure the gentrification signal stands out. Similar to humans focusing on meaningful images in a group, the attention layer first looks for buildings, then examines them closely for improvements over time. It assigns greater importance to images that capture its attention.
Validating the model posed a challenge due to the absence of a definitive measure for gentrification. To address this, the team compared the model to previous attempts using demographic data from the U.S. Census and ACS to label census tracts as gentrifying or non-gentrifying.
In a pilot study covering three cities (Oakland, Denver, and Seattle) with images from 2007 to 2022, the model matched prior work’s gentrification labeling 74% of the time. Notably, the model also flagged potential false positives—census tracts labeled gentrifying that were previously labeled non-gentrifying. Upon closer inspection, these tracts showed signs of gentrification in paired images, suggesting the model captured early gentrification indicators missed by previous studies.