The last few years have seen a significant increase in the number of patent disputes, particularly amongst technology companies. It’s interesting therefore to see a new map that was created by researchers at the University of California, Santa Barbara, that aims to visualise the connectivity of the technology industry.
“We can make maps for different time periods and then see whether new areas of patenting are emerging or develop forecasts to see what kinds of technologies may be up and coming,” says Luciano Kay, a postdoctoral fellow at University of California, Santa Barbara’s Center for Nanotechnology in Society.
“The maps can also be used to examine performance, particularly from the policy perspective, and our overlay technique supports competitive intelligence and policy decision-making,” he continues.
“For example, our maps can reveal relatively unexplored technological areas or highlight denser areas with more technological interdependency, which may be the ground where future technology applications emerge.”
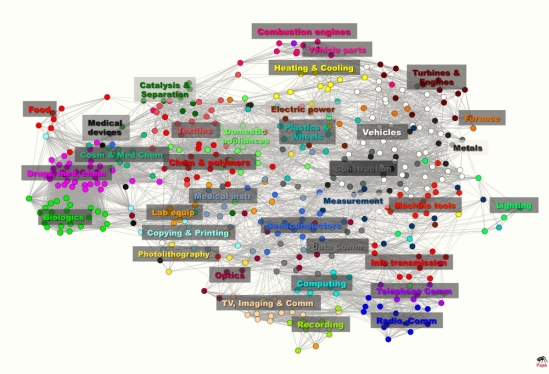
The map uses data from the European Patent Office over a six year period from 2000 onwards, totalling over 760,000 records and 466 patent categories.
“Those classifications of patents usually fall into the function or purpose of the technology,” Kay explains. “But those classifications don’t tell you anything about how closely related the technologies are. So you need the kind of maps we’ve developed to understand that.
“Patent documents have more than one IPC class because the technology usually relates to more than one of those broad categories, such as physics or chemistry, for example,” he continues. “That’s why other maps use the co-occurrences of IPC classes to draw visualizations and connect them. What we use instead are the citations included in the patent record.”
The map connects up two patents if one has cited the other, before classifying them into one of 35 categories, related closely to those of the official IPC classifications. The more links between two patents, the closer the visual distance between them.
The map provides an interesting insight into both the technological areas within which companies are, and have been, working, and also the technologies that are currently being ignored. It helps to show not only how different technologies are related, but also provides a glimpse into how new fields are emerging.
Right now, this new approach to patent mapping largely confers benefits on governments and large companies that can use these tools to gain intelligence about the strengths and weaknesses of their competitors. According to Kay, the maps in the study cover a specific time frame, but one next step might be to look at how the maps evolve over time.